In today’s enterprises, not only the amount of data, but also the data’s complexity is continuously growing over time by linking data objects to each other yielding to dependencies and relations between these objects. Hence, the analysis of an enterprise’s data becomes a challenging task, which becomes even harder by taking into account the information demands of various stakeholders at different times.
In practice, stakeholders are using Spreadsheets (e.g., Microsoft Excel) in order to interactively analyze and visualize certain data sets by their own. However, prevalent Spreadsheets suffer, i.a., from the following shortcomings [Re15b]:
Therefore, the goal of the Spreadsheet 2.0 approach is the development of innovative Spreadsheet concepts addressing the identified drawbacks of existing Spreadsheet applications, e.g., by making the information flow through the spreadsheet transparent:
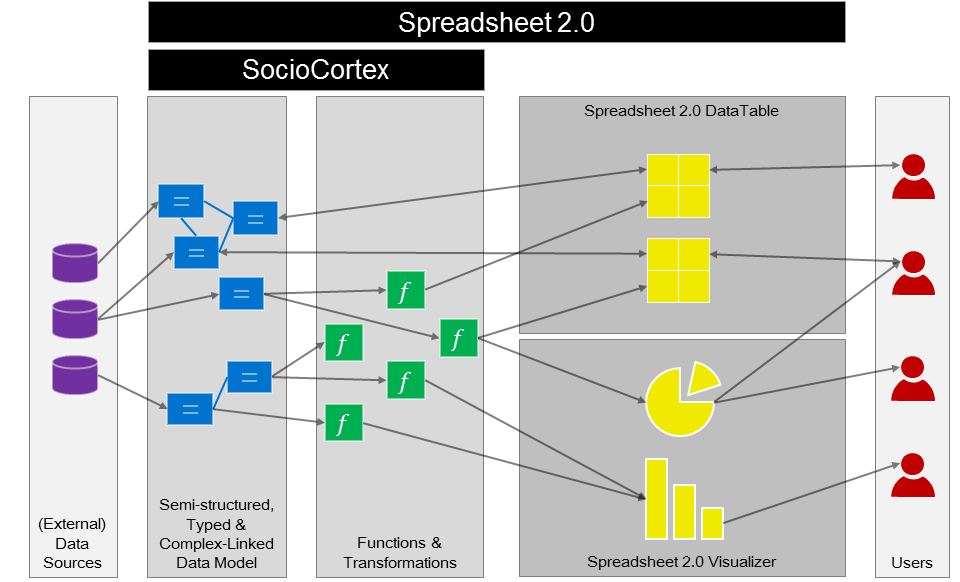
The Spreadsheet 2.0 prototype is built based on the chair's SocioCortex platform, and furthermore consists of two clients, namely the Spreadsheet 2.0 DataTable as part of the SocioCortex Content Manager and the SocioCortex Visualizer. The Spreadsheet 2.0 DataTable component is an end-user-friendly and spreadsheet-like web application for the collaborative management of complex-linked data, while the Visualizer component is a flexible dashboard solution. Through the analysis of data functions and visualizations within the DataTable and Visualizer components respectively, the Spreadsheet 2.0 application can foster the transparency of the information flow from the data's origin to the consuming user.
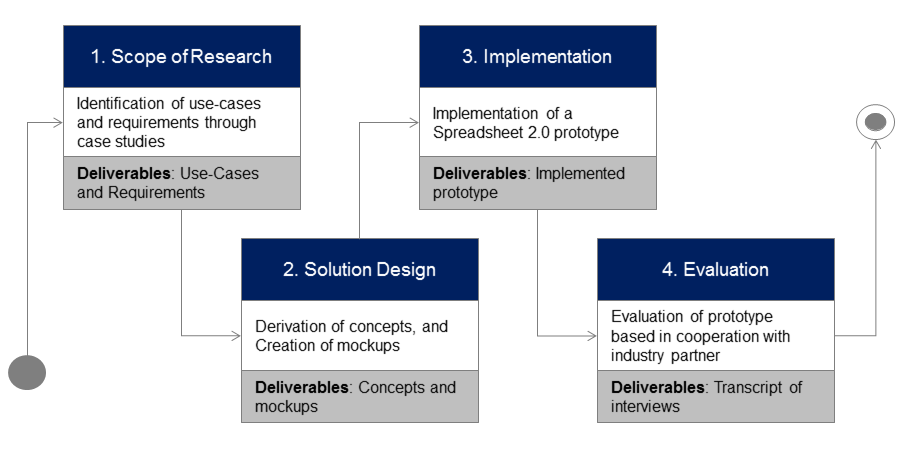
By the implementation of a Spreadsheet 2.0 prototype, these concepts can be evaluated based on requirements gathered from an industry partner [Re15a, Re15b].
Based on identified observed use-cases of the spreadsheets usages at the industry partner (e.g., Capacity Management, Financial Reporting, and Risk Analysis), we derive concepts addressing the shortcomings of those spreadsheets. Subsequently we implement a prototype, which will be evaluated in close cooperation with the industry partner.
There is already a first prototype of the SocioCortex Visualizer, whose goal is to enable end-users to interactively and collaboratively define and design dashboards as an assembly of multiple configurable visualizations (see here). The bindings of the individual visualizations to the respective data are defined by using the base plattform's model-based expression language (MxL) [Re14].
The analyzability of the data bindings and underlying data transformations enables the system to automatically generate an information flow graph, whereas its nodes represent different artifacts of the system including various meta information, e.g., roles and responsibilities of users [Wa15b].
| [Re16e] | Reschenhofer, T.; Waltl, B.; Shumaiev, Klym.; Matthes, F.: A Conceptual Model for Measuring the Complexity of Spreadsheets. In: Proceedings of the European Spreadsheet Risks Interest Group Conference, London, UK, 2016 |
| [Re16d] | Reschenhofer, T.; Bürgin, P.; Matthes, F.: A Social Information Flow Graph - Design and Prototypical Implementation. In: Proceedings of the Conference on Advanced Information Systems Engineering Forum (CAiSE Forum), Ljubljana, Slovenia, 2016 |
| [Re16c] | Reschenhofer, T.; Matthes, F.: Empowering End-users to Collaboratively Manage and Analyze Evolving Data Models. In: Proceedings of the American Conference on Information Systems (AMCIS), San Diego, USA, 2016 |
| [Re16b] | Reschenhofer, T.; Waltl, B.; Gjorgievska, S.; Matthes, F.: A Semantic Meta Model of Spreadsheets. In: Proceedings of the European Conference on Information Systems (ECIS), Istanbul, Turkey, 2016 |
| [Re15b] | Reschenhofer, T.; Matthes, F.: An Empirical Study on Spreadsheet Shortcomings from an Information Systems Perspective. 18th International Conference on Business Information Systems (BIS), Poznan, Poland, 2015. |
| [Wa15b] | Waltl, B.; Reschenhofer, T.; Matthes, F.: Data Governance on EA Information Assets: Logical Reasoning for Derived Data. 10th Trends in Enterprise Architecture Research Workshop (TEAR), Stockholm, Sweden, 2015. |
| [Re15a] | Reschenhofer, T.; Matthes, F.: A Framework for the Identification of Spreadsheet Usage Patterns. 23rd European Conference on Information Systems (ECIS), Münster, Germany, 2015. |
| [Re14b] | Reschenhofer, T.; Monahov, I.; Matthes, F.: Type-Safety in EA Model Analysis. In: Trends in Enterprise Architecture Research Workshop (TEAR), Ulm, Germany, 2014. |