These days, enterprise architects increasingly need quantitative enterprise architecture (EA) models as additional information foundation for decisions besides established qualitative models (e.g. EA domain models). Additionally, a growing number of stakeholders (e.g. compliance or risk management) need specific enterprise architecture management (EAM) metrics. In recent years an increasing number of publications were made on the subject of EAM metrics and performance indicators, however the aspect of metric visualization is not sufficiently addressed.
To close this gap, we develop a foundation for EAM metric visualizations in the conceptional part of this thesis. For this purpose, we analyze existing literature in different research areas (e.g. IT controlling, finance controlling) and suggest specific visualization types for metrics in the EAM domain. Furthermore, we discuss various strengths and weaknesses of the presented visualization types and additionally make suggestions on how specific EAM metrics should be visualized.
In the implementation part of the thesis we show a prototypical implementation of the concepts in an EAM tool developed by our group. This tool supports the definition and life-cycle management of metrics, but currently not the visualization. In addition to that we present the architecture of the implementation together with selected aspects (e.g. a template for the configuration of visualizations) and justify our architectural decisions.
To verify the usability of the solution, we implemented an instance in our tool for a collection of 52 metrics published by our group, and generated the visualizations on the base of test data.
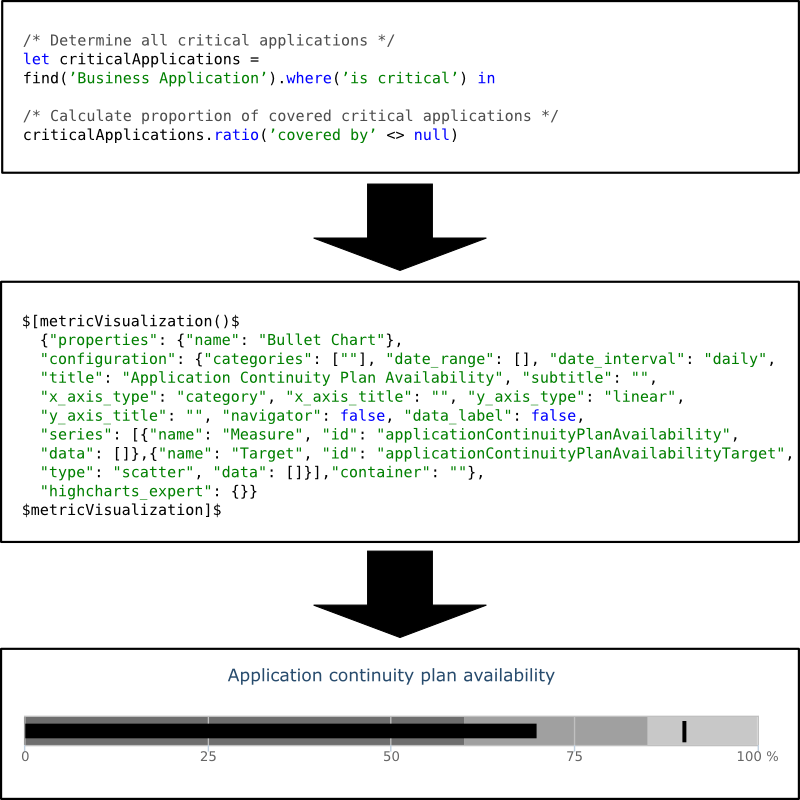
Goal of the thesis is a prototypical extension of Tricia to support the visualization of all metrics of the Metric Catalog defined as MxL expressions. Therefore, the 52 metrics of the catalog are classified by their result type, which can either be a monetary value, multiple values, a number, or a percentage (ratio). Each of the metric can thereby viewed as a snapshot, i.e. the current value, or over time.
To identify recommended visualization types for the metrics of the Metric Catalog the thesis presents a literature review encompassing 29 publications in the fields of IT controlling, enterprise controlling, project management, information visualization, and statistics. For the prototypical extension the following visualizations are selected based on findings in literature: line and area charts, column and bar charts, pie charts, kiviat (spiderweb) charts, and bullet charts (cf. Few [2006]). Consequently the thesis recommends the use of specific visualization types for the representation of specific metrics based on the metric's result type as shown in Table 1:
| Result Type | Perspective | |
|---|---|---|
| snapshot | over time | |
| monetary value | bullet chart | line / column chart |
| multiple values | column chart | line / column chart |
| number | bullet chart | line / column chart |
| percentage | bullet chart | line / column chart |
Furthermore the thesis compares four different web-based visualization libraries for the prototypical extension of Tricia. Each library is evaluated based on the supported visualization types, dynamic visualization generation, interactivity, and availability of documentation. Based on the evaluation, the library Highcharts is chosen as shown in Table 2:
| RGraph | g.Raphaël | NVD3 | Highcharts | |
| Line Chart | ● | ● | ● | ● |
| Area Chart | ● | ○ | ● | ● |
| Column Chart | ● | ● | ● | ● |
| Bar Chart | ● | ● | ● | ● |
| Pie Chart | ● | ● | ● | ● |
| Kiviat Chart | ● | ○ | ○ | ● |
| Bullet Chart | ○ | ○ | ● | ◐ |
| Dynamic | ● | ● | ● | ● |
| Documentation | ● | ● | ○ | ● |
| Interactive | ○ | ◐ | ● | ● |
Consequently, the thesis presents the architecture of the prototypical extension and selected implementation aspects. For example the visualization templates, utilized to define all used visualization types, or the configuration dialog, employed by the user to customize visualizations. The result is an extension of Tricia, able to visualize all metrics of the catalog with user-defined visualizations.

Finally, the prototype is evaluated and the result discussed. Research opportunities exist especially on the topic of usability of the configuration dialog, and on the topic of visualization reusability. For future research, the visualization of historical data, a dynamic configuration dialog, a guided selection of metrics for a visualization, graph visualizations, and graphical drill-down on visualizations can be addressed.
William S Cleveland. The elements of graphing data. Wadsworth advanced books and software Monterey, CA, 1985.
Stephen Few. Information dashboard design. O’Reilly, 2006.
Stephen Few. Now You See It: Simple Visualization Techniques for Quantitative Analysis. Analytics Press, USA, 1st edition, 2009.
Florian Matthes, Ivan Monahov, Alexander Schneider, and Christopher Schulz. Metric Catalog. Technical report, Technische Universität München, 2012a.
Thomas Reschenhofer. Design and prototypical implementation of a model-based structure for the definition and calculation of enterprise architecture key performance indicators. Master’s thesis, Technische Universität München, 2013.
Edward R Tufte. The Visual Display of Quantitative Information, volume 2. Graphics Press Cheshire, CT, 2001.
| Name | Type | Size | Last Modification | Last Editor |
|---|---|---|---|---|
| bullet_chart.png | 96 KB | 15.05.2014 | ||
| MT Schaetzlein - Final.pdf | 456 KB | 27.10.2014 | ||
| MT Schaetzlein - Kickoff.pdf | 456 KB | 27.10.2014 | ||
| schaetzlein_integrated_software_support_for_visualizations.pdf | 1,02 MB | 15.05.2014 |